ELKStack-6.7.1部署
I、服务器设置
1172.16.10.11 server elk
2172.16.10.12 client filebeat
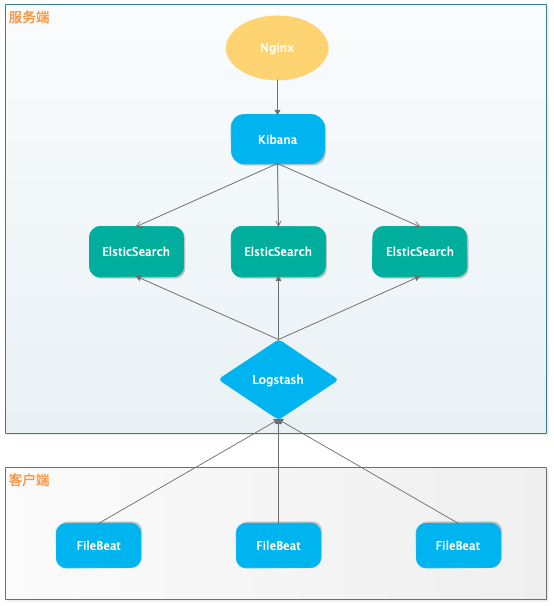
架构图 filebeat –> logstash –> elasticsearch –> kibana
一、安装依赖
1.安装jdk
1wget https://download.oracle.com/otn/java/jdk/8u211-b12/478a62b7d4e34b78b671c754eaaf38ab/jdk-8u211-linux-x64.tar.gz?AuthParam=1556596505_0708cbbd2951fd1f3f6aa1ae12d05fd5
2tar xf jdk-8u211-linux-x64.tar.gz -C /usr
3cd /usr
4mv jdk1.8.0_211 java
添加环境变量
1cat > /etc/profile.d/java.sh <<EOF
2export JAVA_HOME=/usr/java
3export PATH=\${JAVA_HOME}/bin:\$PATH
4EOF
5source /etc/profile
验证安装
1java -version
2java version "1.8.0_211"
3Java(TM) SE Runtime Environment (build 1.8.0_211-b12)
4Java HotSpot(TM) 64-Bit Server VM (build 25.211-b12, mixed mode)
二、Elasticsearch
1.安装elasticsearch
1wget https://artifacts.elastic.co/downloads/elasticsearch/elasticsearch-6.7.1.tar.gz
2tar xf elasticsearch-6.7.1.tar.gz -C /usr/local
3cd /usr/local
4mv elasticsearch-6.7.1 elasticsearch
1useradd elasticsearch
1chown -R elasticsearch:elasticsearch elasticsearch
2.配置elasticsearch
1cd elasticsearch
2vim config/elasticsearch.yml
3cluster.name: elk
4node.name: node-1
5path.data: /usr/local/elasticsearch/data
6path.logs: /usr/local/elasticsearch/logs
7network.host: 172.16.10.11
8http.port: 9200
3.系统设定
max file descriptors [4096] for elasticsearch process is too low, increase to at least [65535]
1echo 'elasticsearch - nofile 65535' >> /etc/security/limits.conf
max virtual memory areas vm.max_map_count [65530] is too low, increase to at least [262144]
1echo 'vm.max_map_count=262144' >> /etc/sysctl.conf
2sysctl -p
4.运行elasticsearch
1su elasticsearch
2cd /usr/local/elasticsearch/bin
3./elasticsearch -d
5.检测运行状态
1netstat -tnlp | grep java
2tcp6       0      0 172.16.10.11:9200       :::*                    LISTEN      25125/java
3tcp6       0      0 172.16.10.11:9300       :::*                    LISTEN      25125/java
 1curl 172.16.10.11:9200
 2{
 3  "name" : "node-1",
 4  "cluster_name" : "elk",
 5  "cluster_uuid" : "_1iSWlWKQ6a0P-qJDi8JuQ",
 6  "version" : {
 7    "number" : "6.7.1",
 8    "build_flavor" : "default",
 9    "build_type" : "tar",
10    "build_hash" : "2f32220",
11    "build_date" : "2019-04-02T15:59:27.961366Z",
12    "build_snapshot" : false,
13    "lucene_version" : "7.7.0",
14    "minimum_wire_compatibility_version" : "5.6.0",
15    "minimum_index_compatibility_version" : "5.0.0"
16  },
17  "tagline" : "You Know, for Search"
18}
看到这个说明es运行正常。
开机启动脚本
 1cat > /usr/lib/systemd/system/elasticsearch.service <<EOF
 2[Unit]
 3Description=Elasticsearch
 4Documentation=http://www.elastic.co
 5Wants=network-online.target
 6After=network-online.target
 7
 8[Service]
 9RuntimeDirectory=elasticsearch
10PrivateTmp=true
11Environment=ES_HOME=/usr/local/elasticsearch
12Environment=ES_PATH_CONF=/usr/local/elasticsearch/config
13Environment=PID_DIR=/usr/local/elasticsearch/logs
14WorkingDirectory=/usr/local/elasticsearch
15
16User=elasticsearch
17Group=elasticsearch
18
19ExecStart=/usr/local/elasticsearch/bin/elasticsearch -p \${PID_DIR}/elasticsearch.pid --quiet
20
21StandardOutput=journal
22StandardError=inherit
23
24LimitNOFILE=65535
25LimitNPROC=4096
26LimitAS=infinity
27LimitFSIZE=infinity
28TimeoutStopSec=0
29KillSignal=SIGTERM
30KillMode=process
31SendSIGKILL=no
32SuccessExitStatus=143
33
34[Install]
35WantedBy=multi-user.target
36EOF
1systemctl enable elasticsearch
2systemctl start elasticsearch
三、logstash
1.安装logstash
1wget https://artifacts.elastic.co/downloads/logstash/logstash-6.7.1.tar.gz
2tar xf logstash-6.7.1.tar.gz -C /usr/local
3cd /usr/local
4mv logstash-6.7.1 logstash
5cd logstash
2.配置logstash
 1vim config/logstash-sample.conf
 2input {
 3  beats {
 4    port => 5044
 5  }
 6}
 7
 8output {
 9  elasticsearch {
10    hosts => ["http://172.16.10.11:9200"]
11    index => "%{[@metadata][beat]}-%{[@metadata][version]}-%{+YYYY.MM.dd}"
12  }
13}
3.运行logstash
1./bin/logstash -f config/logstash-sample.conf
4.检测logstash运行状态
1netstat -tnlp | grep java
2tcp6       0      0 127.0.0.1:9600          :::*                    LISTEN      25428/java
3tcp6       0      0 172.16.10.11:9200       :::*                    LISTEN      25125/java
4tcp6       0      0 :::5044                 :::*                    LISTEN      25428/java
5tcp6       0      0 172.16.10.11:9300       :::*                    LISTEN      25125/java
看到logstash已经正常监听5044端口,说明运行正常。
开机启动脚本
 1cat > /usr/lib/systemd/system/logstash.service <<EOF
 2[Unit]
 3Description=logstash
 4
 5[Service]
 6Type=simple
 7User=logstash
 8Group=logstash
 9EnvironmentFile=-/etc/default/logstash
10EnvironmentFile=-/etc/sysconfig/logstash
11ExecStart=/usr/local/logstash/bin/logstash "--path.settings" "/usr/local/logstash/config"
12Restart=always
13WorkingDirectory=/
14Nice=19
15LimitNOFILE=16384
16
17[Install]
18WantedBy=multi-user.target
19EOF
1systemctl enable logstash
2systemctl start logstash
四、Kibana
1.安装kibana
1tar xf kibana-6.7.1-linux-x86_64.tar.gz -C /usr/local/
2cd /usr/local
3mv kibana-6.7.1-linux-x86_64 kibana
4cd kibana
2.配置kibana
1vim config/kibana.yml
2server.port: 5601
3server.host: "172.16.10.11"
4server.name: "elk"
5elasticsearch.hosts: ["http://172.16.10.11:9200"]
6kibana.index: ".kibana"
7kibana.defaultAppId: "home"
3.运行kibana
1./bin/kibana
开机启动脚本
 1cat > /usr/lib/systemd/system/kibana.service <<EOF
 2[Unit]
 3Description=Kibana
 4StartLimitIntervalSec=30
 5StartLimitBurst=3
 6
 7[Service]
 8Type=simple
 9User=kibana
10Group=kibana
11EnvironmentFile=-/etc/default/kibana
12EnvironmentFile=-/etc/sysconfig/kibana
13ExecStart=/usr/local/kibana/bin/kibana "-c /usr/local/kibana/config/kibana.yml"
14Restart=always
15WorkingDirectory=/
16
17[Install]
18WantedBy=multi-user.target
19EOF
1systemctl enable kibana
2systemctl start kibana
五、nginx反向代理
1.安装nginx
1yum -y install epel-release
2yum -y install nginx
2.配置反向代理
1vim /etc/nginx/nginx.conf
3.运行nginx
1systemctl enable nginx
2systemctl start nginx
II、客户端配置
一、安装filebeat
1.安装filebeat
1wget https://artifacts.elastic.co/downloads/beats/filebeat/filebeat-6.7.1-linux-x86_64.tar.gz
2tar xf filebeat-6.7.1-linux-x86_64.tar.gz -C /usr/local
3cd /usr/local
4mv filebeat-6.7.1-linux-x86_64 filebeat
5cd filebeat
2.配置filebeat
 1vim filebeat.yml
 2filebeat.inputs:
 3- type: log
 4  enabled: true
 5  paths:
 6    - /var/log/*.log
 7filebeat.config.modules:
 8  path: ${path.config}/modules.d/*.yml
 9  reload.enabled: false
10setup.template.settings:
11  index.number_of_shards: 3
12setup.kibana:
13  host: "172.16.10.11"
14output.logstash:
15  hosts: ["172.16.10.11:5044"]
16processors:
17  - add_host_metadata: ~
18  - add_cloud_metadata: ~
3.运行filebeat
1./filebeat -e -c filebeat.yml
 1[Unit]
 2Description=Filebeat sends log files to Logstash or directly to Elasticsearch.
 3Documentation=https://www.elastic.co/products/beats/filebeat
 4Wants=network-online.target
 5After=network-online.target
 6
 7[Service]
 8ExecStart=/usr/local/filebeat/bin/filebeat \
 9          -c /usr/local/filebeat/filebeat.yml \
10          -path.home /usr/local/filebeat \
11          -path.config /usr/local/filebeat \
12          -path.data /usr/local/filebeat/lib \
13          -path.logs /usr/local/filebeat/logs
14Restart=always
15[Install]
16WantedBy=multi-user.target
4.页面设置kibana
打开浏览器,输入http://172.16.10.11
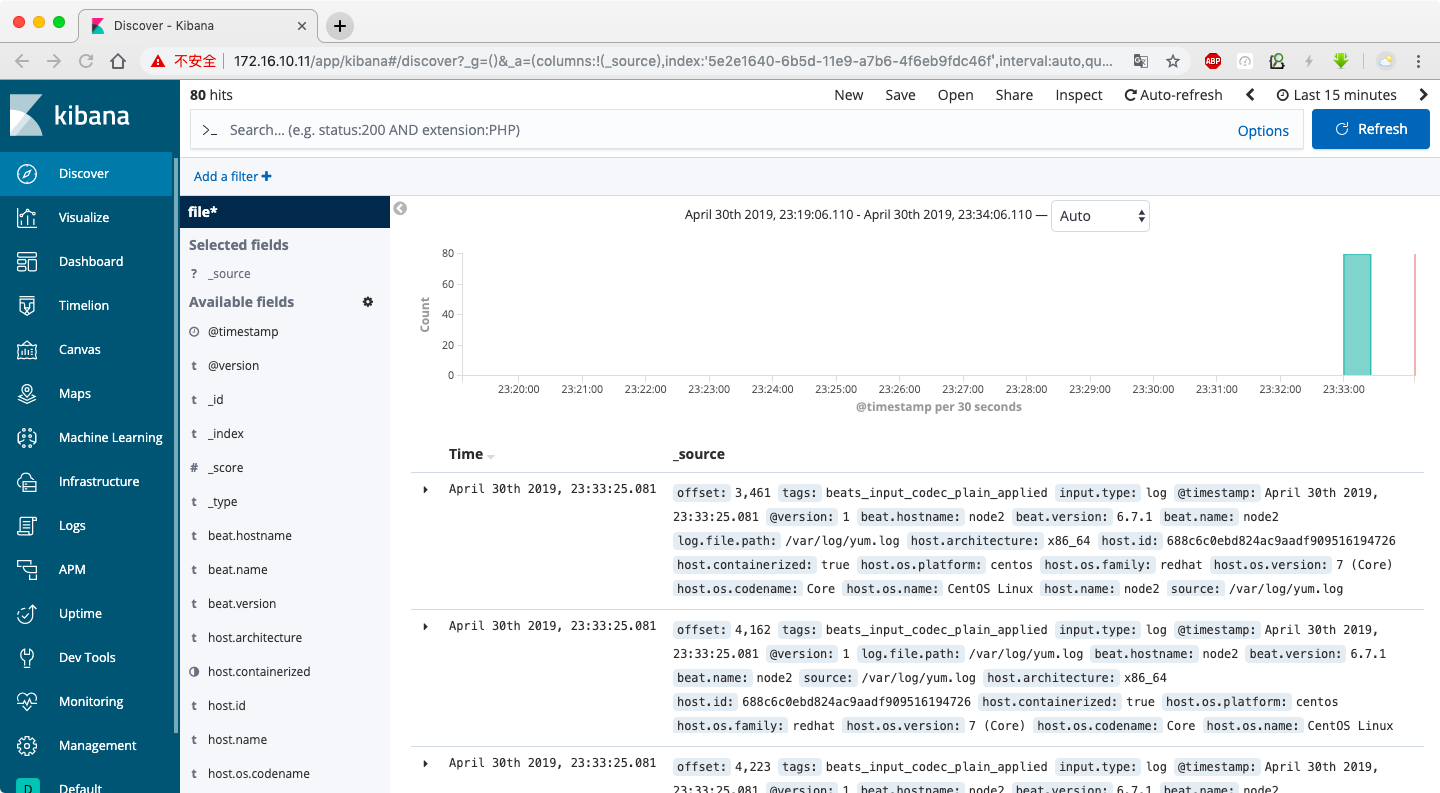
添加索引,查找filebeat开头的filebeat*进行匹配,能看到index说明filebeat能够通过logstash把日志写入到es中,并加es数据通过可视化工具kibana展示出来。
- 原文作者:黄忠德
- 原文链接:https://huangzhongde.cn/post/2019-04-30-ELKStack671-deploy/
- 版权声明:本作品采用知识共享署名-非商业性使用-禁止演绎 4.0 国际许可协议进行许可,非商业转载请注明出处(作者,原文链接),商业转载请联系作者获得授权。