Prometheus与Grafana入门
Prometheus入门
Prometheus简介
Prometheus 是一套开源的系统监控报警框架。它启发于 Google 的 borgmon 监控系统,由工作在 SoundCloud 的 google 前员工在 2012 年创建,作为社区开源项目进行开发,并于 2015 年正式发布。2016 年,Prometheus 正式加入 Cloud Native Computing Foundation,成为受欢迎度仅次于 Kubernetes 的项目。
作为新一代开源解决方案,很多理念与 Google SRE 运维之道不谋而合。
特性
Prometheus的主要特性是:
-
一个多维数据模型,其中包含通过度量标准名称和键/值对标识的时间序列数据
-
PromQL,一种灵活的查询语言 ,可利用此维度
-
不依赖分布式存储;单服务器节点是自治的
-
时间序列收集通过HTTP上的拉模型进行
-
通过中间网关支持推送时间序列
-
通过服务发现或静态配置发现目标
-
多种图形和仪表板支持模式
组件
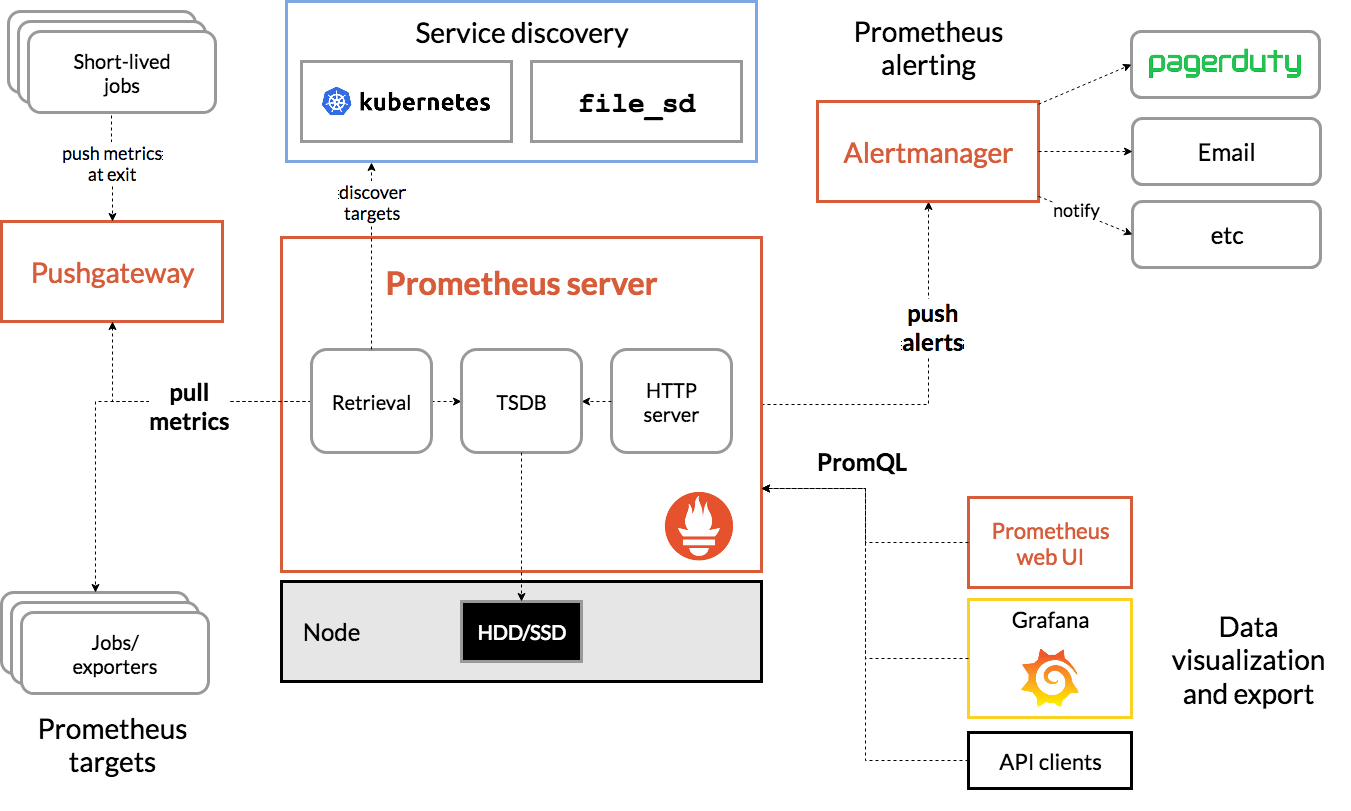
Prometheus生态系统包含多个组件,其中许多是可选的:
- Prometheus Server,用于收集和存储时间序列数据
- Client Library,客户端库,为需要监控的服务生成相应的 metrics 并暴露给 Prometheus server。当 Prometheus server 来 pull 时,直接返回实时状态的 metrics
- Push Gateway: 主要用于短期的 jobs。由于这类 jobs 存在时间较短,可能在 Prometheus 来 pull 之前就消失了。为此,这次 jobs 可以直接向 Prometheus server 端推送它们的 metrics。这种方式主要用于服务层面的 metrics,对于机器层面的 metrices,需要使用 node exporter。
- Exporters: 用于暴露已有的第三方服务的 metrics 给 Prometheus。
- Alertmanager: 从 Prometheus server 端接收到 alerts 后,会进行去除重复数据,分组,并路由到对收的接受方式,发出报警。常见的接收方式有:电子邮件,pagerduty,OpsGenie, webhook 等。
- 一些其他的工具
大多数Prometheus组件都是用Go语言编写的,因此易于构建和部署为静态二进制文件。
架构
安装Prometheus
环境准备
| Roles | Address |
|---|---|
| Prometheus Server | 172.16.10.10 |
| Node exporter | 172.16.10.11 |
Node exporter安装
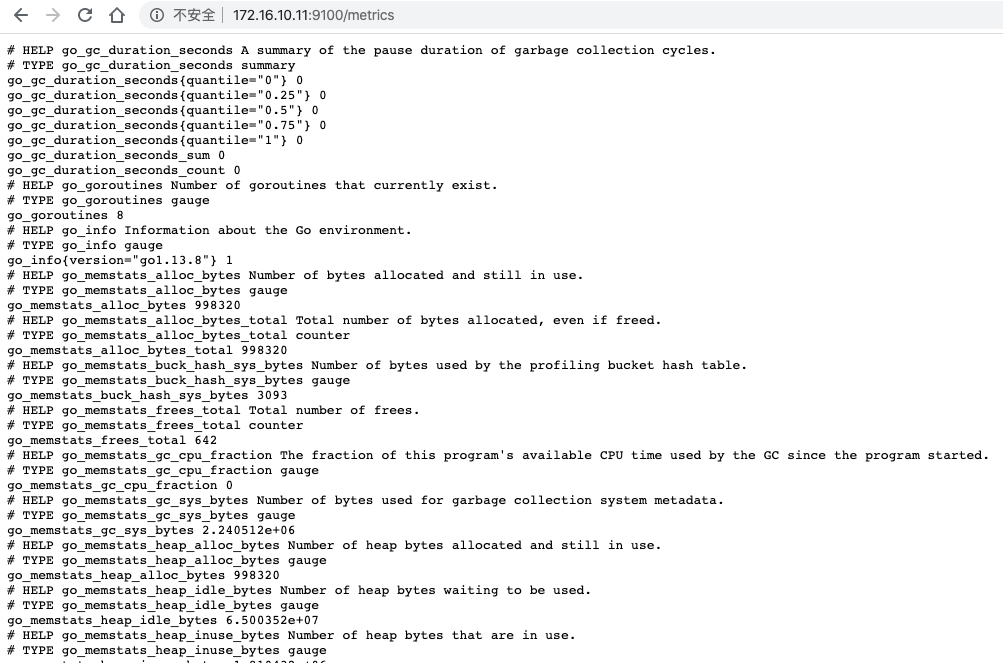
Node exporter 主要用于暴露 metrics 给 Prometheus,其中 metrics 包括:cpu 的负载,内存的使用情况,网络等。
安装包获取可以在Github.com上获取最新的二进制包node_exporter
我这里用的CentOS8.1.1911_64位的系统,根据自己的操作系统版本类型进行选择。
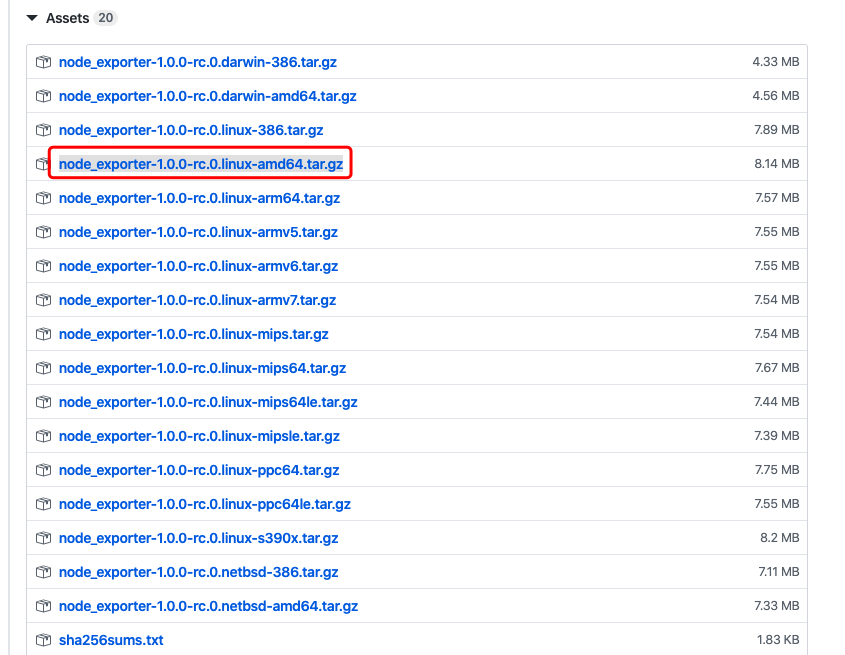
1tar xf node_exporter-1.0.0-rc.0.linux-amd64.tar.gz -C /usr/bin/ --strip-components 1 node_exporter-1.0.0-rc.0.linux-amd64/node_exporter
运行
运行起来非常简单,可以通过–help查看选项,也可以直接运行
  1node_exporter  --help
  2usage: node_exporter [<flags>]
  3
  4Flags:
  5  -h, --help                    Show context-sensitive help (also try --help-long and --help-man).
  6      --collector.cpu.info      Enables metric cpu_info
  7      --collector.diskstats.ignored-devices="^(ram|loop|fd|(h|s|v|xv)d[a-z]|nvme\\d+n\\d+p)\\d+$"
  8                                Regexp of devices to ignore for diskstats.
  9      --collector.filesystem.ignored-mount-points="^/(dev|proc|sys|var/lib/docker/.+)($|/)"
 10                                Regexp of mount points to ignore for filesystem collector.
 11      --collector.filesystem.ignored-fs-types="^(autofs|binfmt_misc|bpf|cgroup2?|configfs|debugfs|devpts|devtmpfs|fusectl|hugetlbfs|iso9660|mqueue|nsfs|overlay|proc|procfs|pstore|rpc_pipefs|securityfs|selinuxfs|squashfs|sysfs|tracefs)$"
 12                                Regexp of filesystem types to ignore for filesystem collector.
 13      --collector.netclass.ignored-devices="^$"
 14                                Regexp of net devices to ignore for netclass collector.
 15      --collector.netdev.device-blacklist=COLLECTOR.NETDEV.DEVICE-BLACKLIST
 16                                Regexp of net devices to blacklist (mutually exclusive to device-whitelist).
 17      --collector.netdev.device-whitelist=COLLECTOR.NETDEV.DEVICE-WHITELIST
 18                                Regexp of net devices to whitelist (mutually exclusive to device-blacklist).
 19      --collector.netstat.fields="^(.*_(InErrors|InErrs)|Ip_Forwarding|Ip(6|Ext)_(InOctets|OutOctets)|Icmp6?_(InMsgs|OutMsgs)|TcpExt_(Listen.*|Syncookies.*|TCPSynRetrans)|Tcp_(ActiveOpens|InSegs|OutSegs|PassiveOpens|RetransSegs|CurrEstab)|Udp6?_(InDatagrams|OutDatagrams|NoPorts|RcvbufErrors|SndbufErrors))$"
 20                                Regexp of fields to return for netstat collector.
 21      --collector.ntp.server="127.0.0.1"
 22                                NTP server to use for ntp collector
 23      --collector.ntp.protocol-version=4
 24                                NTP protocol version
 25      --collector.ntp.server-is-local
 26                                Certify that collector.ntp.server address is the same local host as this collector.
 27      --collector.ntp.ip-ttl=1  IP TTL to use while sending NTP query
 28      --collector.ntp.max-distance=3.46608s
 29                                Max accumulated distance to the root
 30      --collector.ntp.local-offset-tolerance=1ms
 31                                Offset between local clock and local ntpd time to tolerate
 32      --path.procfs="/proc"     procfs mountpoint.
 33      --path.sysfs="/sys"       sysfs mountpoint.
 34      --path.rootfs="/"         rootfs mountpoint.
 35      --collector.perf.cpus=""  List of CPUs from which perf metrics should be collected
 36      --collector.powersupply.ignored-supplies="^$"
 37                                Regexp of power supplies to ignore for powersupplyclass collector.
 38      --collector.qdisc.fixtures=""
 39                                test fixtures to use for qdisc collector end-to-end testing
 40      --collector.runit.servicedir="/etc/service"
 41                                Path to runit service directory.
 42      --collector.supervisord.url="http://localhost:9001/RPC2"
 43                                XML RPC endpoint.
 44      --collector.systemd.unit-whitelist=".+"
 45                                Regexp of systemd units to whitelist. Units must both match whitelist and not match blacklist to be included.
 46      --collector.systemd.unit-blacklist=".+\\.(automount|device|mount|scope|slice)"
 47                                Regexp of systemd units to blacklist. Units must both match whitelist and not match blacklist to be included.
 48      --collector.systemd.enable-task-metrics
 49                                Enables service unit tasks metrics unit_tasks_current and unit_tasks_max
 50      --collector.systemd.enable-restarts-metrics
 51                                Enables service unit metric service_restart_total
 52      --collector.systemd.enable-start-time-metrics
 53                                Enables service unit metric unit_start_time_seconds
 54      --collector.textfile.directory=""
 55                                Directory to read text files with metrics from.
 56      --collector.vmstat.fields="^(oom_kill|pgpg|pswp|pg.*fault).*"
 57                                Regexp of fields to return for vmstat collector.
 58      --collector.wifi.fixtures=""
 59                                test fixtures to use for wifi collector metrics
 60      --collector.arp           Enable the arp collector (default: enabled).
 61      --collector.bcache        Enable the bcache collector (default: enabled).
 62      --collector.bonding       Enable the bonding collector (default: enabled).
 63      --collector.btrfs         Enable the btrfs collector (default: enabled).
 64      --collector.buddyinfo     Enable the buddyinfo collector (default: disabled).
 65      --collector.conntrack     Enable the conntrack collector (default: enabled).
 66      --collector.cpu           Enable the cpu collector (default: enabled).
 67      --collector.cpufreq       Enable the cpufreq collector (default: enabled).
 68      --collector.diskstats     Enable the diskstats collector (default: enabled).
 69      --collector.drbd          Enable the drbd collector (default: disabled).
 70      --collector.edac          Enable the edac collector (default: enabled).
 71      --collector.entropy       Enable the entropy collector (default: enabled).
 72      --collector.filefd        Enable the filefd collector (default: enabled).
 73      --collector.filesystem    Enable the filesystem collector (default: enabled).
 74      --collector.hwmon         Enable the hwmon collector (default: enabled).
 75      --collector.infiniband    Enable the infiniband collector (default: enabled).
 76      --collector.interrupts    Enable the interrupts collector (default: disabled).
 77      --collector.ipvs          Enable the ipvs collector (default: enabled).
 78      --collector.ksmd          Enable the ksmd collector (default: disabled).
 79      --collector.loadavg       Enable the loadavg collector (default: enabled).
 80      --collector.logind        Enable the logind collector (default: disabled).
 81      --collector.mdadm         Enable the mdadm collector (default: enabled).
 82      --collector.meminfo       Enable the meminfo collector (default: enabled).
 83      --collector.meminfo_numa  Enable the meminfo_numa collector (default: disabled).
 84      --collector.mountstats    Enable the mountstats collector (default: disabled).
 85      --collector.netclass      Enable the netclass collector (default: enabled).
 86      --collector.netdev        Enable the netdev collector (default: enabled).
 87      --collector.netstat       Enable the netstat collector (default: enabled).
 88      --collector.nfs           Enable the nfs collector (default: enabled).
 89      --collector.nfsd          Enable the nfsd collector (default: enabled).
 90      --collector.ntp           Enable the ntp collector (default: disabled).
 91      --collector.perf          Enable the perf collector (default: disabled).
 92      --collector.powersupplyclass
 93                                Enable the powersupplyclass collector (default: enabled).
 94      --collector.pressure      Enable the pressure collector (default: enabled).
 95      --collector.processes     Enable the processes collector (default: disabled).
 96      --collector.qdisc         Enable the qdisc collector (default: disabled).
 97      --collector.rapl          Enable the rapl collector (default: enabled).
 98      --collector.runit         Enable the runit collector (default: disabled).
 99      --collector.schedstat     Enable the schedstat collector (default: enabled).
100      --collector.sockstat      Enable the sockstat collector (default: enabled).
101      --collector.softnet       Enable the softnet collector (default: enabled).
102      --collector.stat          Enable the stat collector (default: enabled).
103      --collector.supervisord   Enable the supervisord collector (default: disabled).
104      --collector.systemd       Enable the systemd collector (default: disabled).
105      --collector.tcpstat       Enable the tcpstat collector (default: disabled).
106      --collector.textfile      Enable the textfile collector (default: enabled).
107      --collector.thermal_zone  Enable the thermal_zone collector (default: enabled).
108      --collector.time          Enable the time collector (default: enabled).
109      --collector.timex         Enable the timex collector (default: enabled).
110      --collector.uname         Enable the uname collector (default: enabled).
111      --collector.vmstat        Enable the vmstat collector (default: enabled).
112      --collector.wifi          Enable the wifi collector (default: disabled).
113      --collector.xfs           Enable the xfs collector (default: enabled).
114      --collector.zfs           Enable the zfs collector (default: enabled).
115      --web.listen-address=":9100"
116                                Address on which to expose metrics and web interface.
117      --web.telemetry-path="/metrics"
118                                Path under which to expose metrics.
119      --web.disable-exporter-metrics
120                                Exclude metrics about the exporter itself (promhttp_*, process_*, go_*).
121      --web.max-requests=40     Maximum number of parallel scrape requests. Use 0 to disable.
122      --collector.disable-defaults
123                                Set all collectors to disabled by default.
124      --web.config=""           [EXPERIMENTAL] Path to config yaml file that can enable TLS or authentication.
125      --log.level=info          Only log messages with the given severity or above. One of: [debug, info, warn, error]
126      --log.format=logfmt       Output format of log messages. One of: [logfmt, json]
127      --version                 Show application version.
启动完成之后默认会监听9100端口,通过该端口可以访问获取到的指标数据
开机启动脚本
 1[Unit]
 2Description=prometheus node_exporter
 3Documentation=https://prometheus.io
 4After=network.target
 5
 6[Service]
 7ExecStart=/usr/bin/node_exporter
 8ExecReload=/bin/kill -HUP $MAINPID
 9KillMode=process
10Restart=always
11RestartSec=30s
12
13[Install]
14WantedBy=multi-user.target
Prometheus安装
也是在Github上面下载,最新版本2.16.0prometheus
1tar xf prometheus-2.16.0.linux-amd64.tar.gz -C /usr/local
2cd /usr/local/prometheus-2.16.0.linux-amd64
运行
 1./prometheus
 2level=info ts=2020-03-06T03:31:42.748Z caller=main.go:295 msg="no time or size retention was set so using the default time retention" duration=15d
 3level=info ts=2020-03-06T03:31:42.748Z caller=main.go:331 msg="Starting Prometheus" version="(version=2.16.0, branch=HEAD, revision=b90be6f32a33c03163d700e1452b54454ddce0ec)"
 4level=info ts=2020-03-06T03:31:42.748Z caller=main.go:332 build_context="(go=go1.13.8, user=root@7ea0ae865f12, date=20200213-23:50:02)"
 5level=info ts=2020-03-06T03:31:42.748Z caller=main.go:333 host_details="(Linux 4.18.0-147.3.1.el8_1.x86_64 #1 SMP Fri Jan 3 23:55:26 UTC 2020 x86_64 node0 (none))"
 6level=info ts=2020-03-06T03:31:42.748Z caller=main.go:334 fd_limits="(soft=65535, hard=65535)"
 7level=info ts=2020-03-06T03:31:42.748Z caller=main.go:335 vm_limits="(soft=unlimited, hard=unlimited)"
 8level=info ts=2020-03-06T03:31:42.751Z caller=main.go:661 msg="Starting TSDB ..."
 9level=info ts=2020-03-06T03:31:42.751Z caller=web.go:508 component=web msg="Start listening for connections" address=0.0.0.0:9090
10level=info ts=2020-03-06T03:31:42.754Z caller=head.go:577 component=tsdb msg="replaying WAL, this may take awhile"
11level=info ts=2020-03-06T03:31:42.761Z caller=head.go:625 component=tsdb msg="WAL segment loaded" segment=0 maxSegment=2
12level=info ts=2020-03-06T03:31:42.762Z caller=head.go:625 component=tsdb msg="WAL segment loaded" segment=1 maxSegment=2
13level=info ts=2020-03-06T03:31:42.762Z caller=head.go:625 component=tsdb msg="WAL segment loaded" segment=2 maxSegment=2
14level=info ts=2020-03-06T03:31:42.765Z caller=main.go:676 fs_type=XFS_SUPER_MAGIC
15level=info ts=2020-03-06T03:31:42.765Z caller=main.go:677 msg="TSDB started"
16level=info ts=2020-03-06T03:31:42.765Z caller=main.go:747 msg="Loading configuration file" filename=prometheus.yml
17level=info ts=2020-03-06T03:31:42.766Z caller=main.go:775 msg="Completed loading of configuration file" filename=prometheus.yml
18level=info ts=2020-03-06T03:31:42.766Z caller=main.go:630 msg="Server is ready to receive web requests."
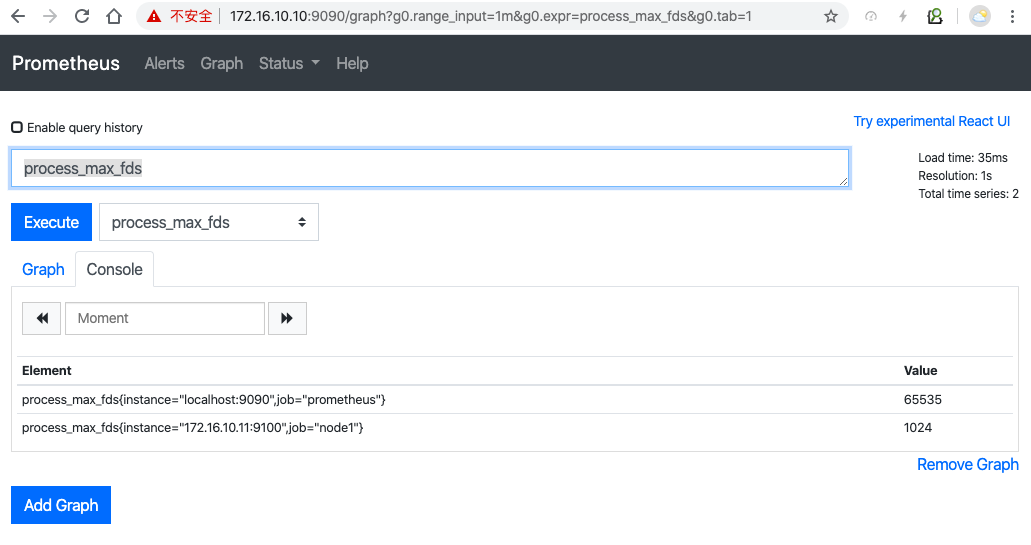
运行起来之后监听9090端口。可以通过访问该web页面,使用PromQL语句进行查询,里面内置了很多查询语句。
开机启动脚本
 1[Unit]
 2Description=prometheus server
 3Documentation=https://prometheus.io
 4After=network.target
 5
 6[Service]
 7ExecStart=/usr/local/prometheus-2.16.0.linux-amd64/prometheus
 8ExecReload=/bin/kill -HUP $MAINPID
 9KillMode=process
10Restart=always
11RestartSec=30s
12
13[Install]
14WantedBy=multi-user.target
获取Node_exporter的数据
修改prometheus.yml配置文件
1scrape_configs:
2  - job_name: 'node1'  # 一定要全局唯一, 采集本机的 metrics,需要在本机安装 node_exporter
3    static_configs:
4    - targets: ['172.16.10.11:9100']
然后重新启动prometheus就可以拉取node_exporter的数据了。
比如获取节点文件句柄数
Alertmanager
Alertmanager 主要用于接收 Prometheus 发送的告警信息,它支持丰富的告警通知渠道,而且很容易做到告警信息进行去重,降噪,分组,策略路由,是一款前卫的告警通知系统。
通过它我们可以配置邮件,企业微信,Slack,WebHook,hitChat等告警。
安装alertmanager
Alertmanager下载地址alertmanager
1tar xf alertmanager-0.20.0.linux-amd64.tar.gz -C /usr/local
2cd /usr/local/alertmanager-0.20.0.linux-amd64
3./alertmanager
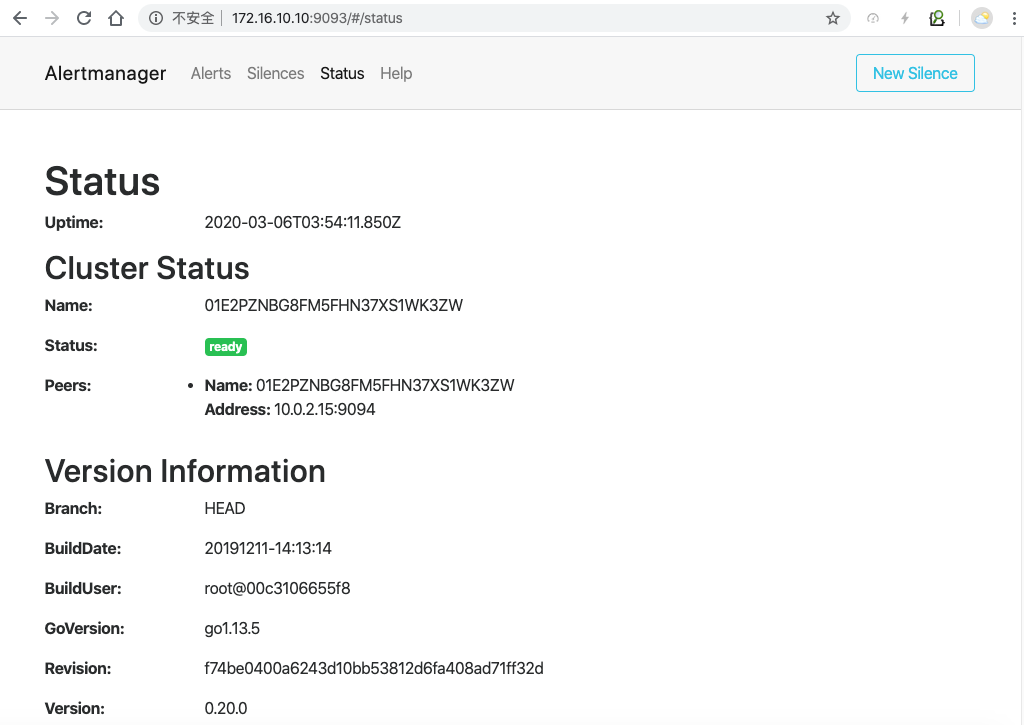
运行之后默认监听在9093端口上。
自带的默认是web_hook告警示例
 1global:
 2  resolve_timeout: 5m
 3
 4route:
 5  group_by: ['alertname']
 6  group_wait: 10s
 7  group_interval: 10s
 8  repeat_interval: 1h
 9  receiver: 'web.hook'
10receivers:
11- name: 'web.hook'
12  webhook_configs:
13  - url: 'http://127.0.0.1:5001/'
14inhibit_rules:
15  - source_match:
16      severity: 'critical'
17    target_match:
18      severity: 'warning'
19    equal: ['alertname', 'dev', 'instance']
开机启动脚本
 1[Unit]
 2Description=prometheus alertmanager
 3Documentation=https://prometheus.io
 4After=network.target
 5
 6[Service]
 7ExecStart=/usr/local/alertmanager-0.20.0.linux-amd64/alertmanager
 8ExecReload=/bin/kill -HUP $MAINPID
 9KillMode=process
10Restart=always
11RestartSec=30s
12
13[Install]
14WantedBy=multi-user.target
告警数据推送给alertmanger
修改prometheus.yml配置文件
1alerting:
2  alertmanagers:
3  - static_configs:
4    - targets:
5      - 127.0.0.1:9093
6
7rule_files: # 警告规则设置文件
8  - '/usr/local/prometheus-2.16.0.linux-amd64/alert.rules'
alert.rules
1# Alert for any instance that is unreachable for >5 minutes.
2ALERT InstanceDown   # alert 名字
3  IF up == 0           # 判断条件
4  FOR 5m             # 条件保持 5m 才会发出 alert
5  LABELS { severity = "critical" }  # 设置 alert 的标签
6  ANNOTATIONS {             # alert 的其他标签,但不用于标识 alert
7    summary = "Instance {{ $labels.instance }} down",
8    description = "{{ $labels.instance }} of job {{ $labels.job }} has been down for more than 5 minutes.",
9  }
然后重启Prometheus服务。
数据已经采集到了,我们需要一个仪表盘来可视化的观察我们需要监控的数据,比如网络带宽,系统负载等等。这就是我们下面要介绍的Grafana。
Grafana
Grafana介绍
Grafana介绍
Grafana是一个跨平台的开源的度量分析和可视化工具,可以通过将采集的数据查询然后可视化的展示,并及时通知。它主要有以下六大特点:
-
展示方式:快速灵活的客户端图表,面板插件有许多不同方式的可视化指标和日志,官方库中具有丰富的仪表盘插件,比如热图、折线图、图表等多种展示方式;
-
数据源:Graphite,InfluxDB,OpenTSDB,Prometheus,Elasticsearch,CloudWatch和KairosDB等;
-
通知提醒:以可视方式定义最重要指标的警报规则,Grafana将不断计算并发送通知,在数据达到阈值时通过Slack、PagerDuty等获得通知;
-
混合展示:在同一图表中混合使用不同的数据源,可以基于每个查询指定数据源,甚至自定义数据源;
-
注释:使用来自不同数据源的丰富事件注释图表,将鼠标悬停在事件上会显示完整的事件元数据和标记;
-
过滤器:Ad-hoc过滤器允许动态创建新的键/值过滤器,这些过滤器会自动应用于使用该数据源的所有查询。
Grafana安装
上Grafana官网进行下载,目前最新的版本是6.6.2
1wget https://dl.grafana.com/oss/release/grafana-6.6.2.linux-amd64.tar.gz
2tar xf grafana-6.6.2.linux-amd64.tar.gz -C /usr/local
3cd /usr/local/grafana-6.6.2
4./bin/grafana-server
默认监听端口3000,默认用户名:admin 密码:admin
启动完通过web界面进行登录
基本操作
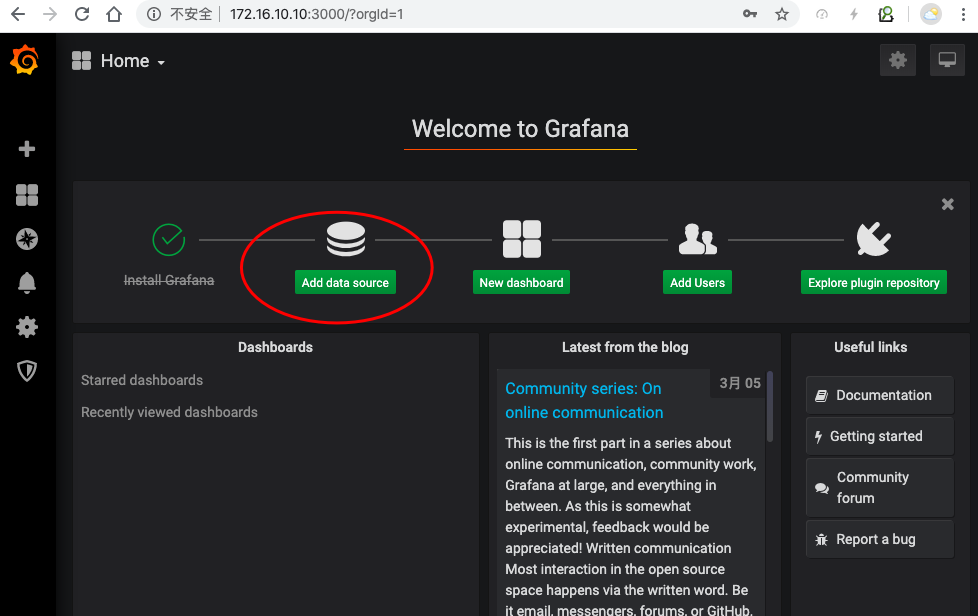
添加数据源
点击add data resource
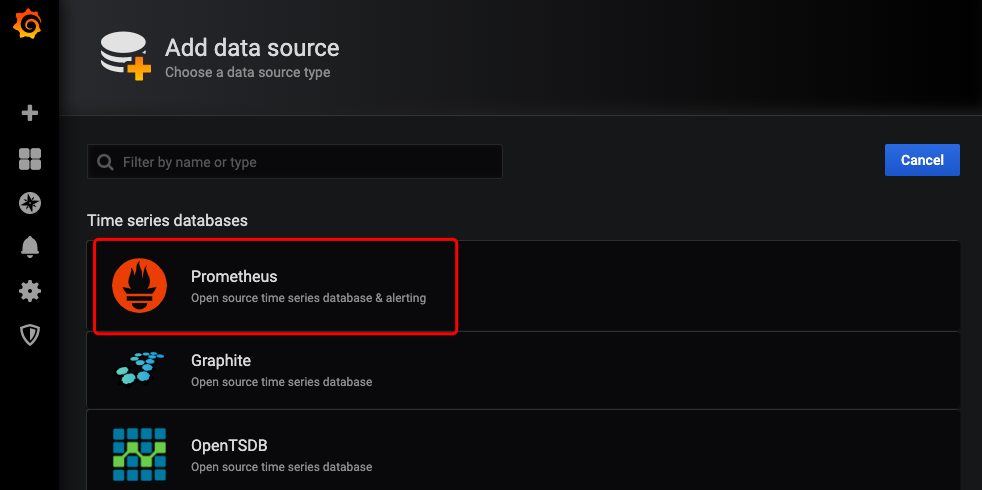
选择Prometheus作为我们的数据源
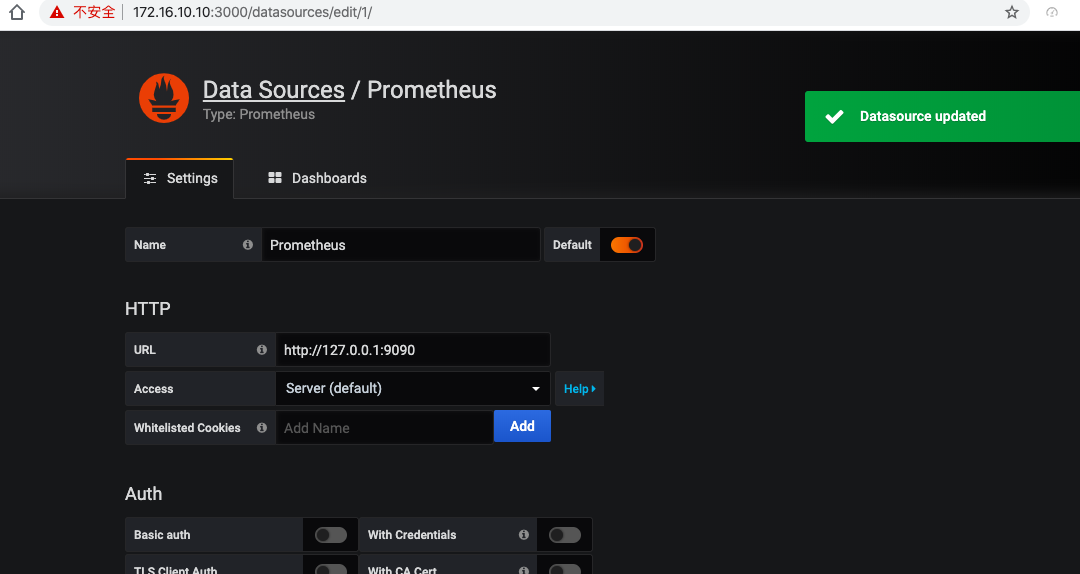
添加完点Save & Test
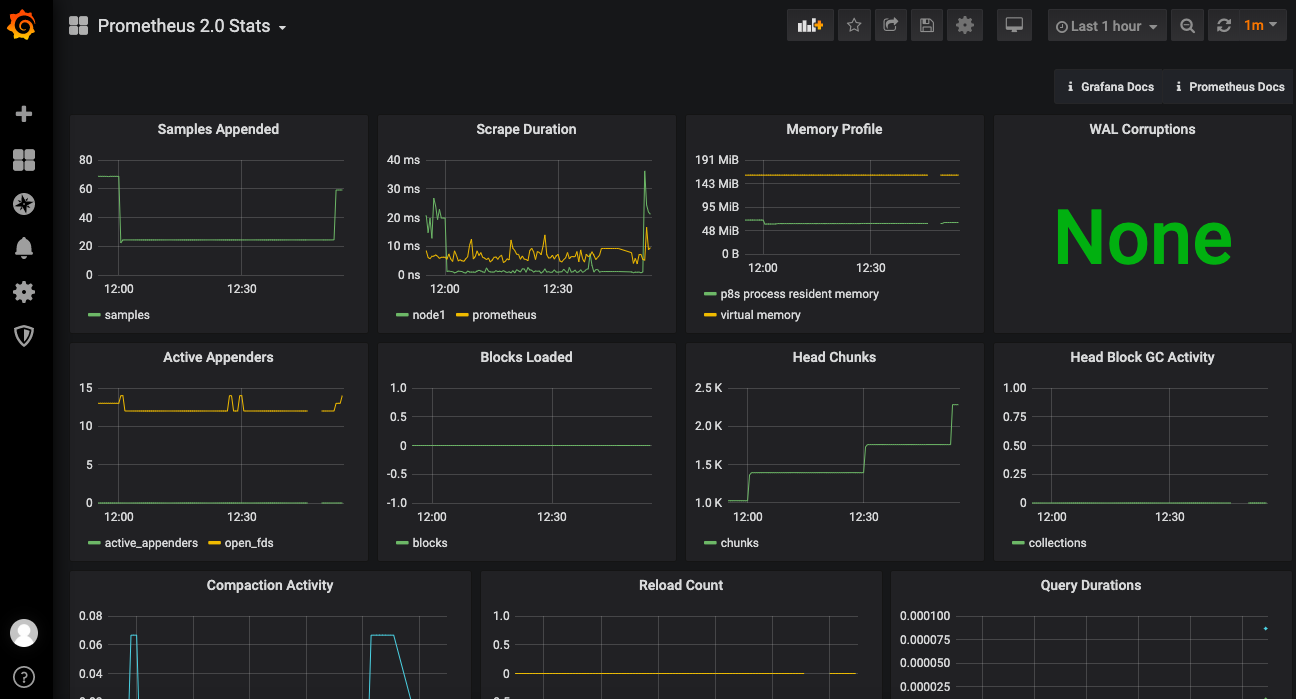
添加完之后自带三款prometheus的dashboard,点击import导入即可。
在Kubernetes上面的安装见Istio实战指南
- 原文作者:黄忠德
- 原文链接:https://huangzhongde.cn/post/Linux/2020-03-07_prometheus_grafana_introduce/
- 版权声明:本作品采用知识共享署名-非商业性使用-禁止演绎 4.0 国际许可协议进行许可,非商业转载请注明出处(作者,原文链接),商业转载请联系作者获得授权。