使用Prometheus监控MySQL
prometheus出了前面将了能监控系统的性能指标外,还能监控具体的应用程序,只需要按照prometheus约定的格式收集指标即可。这里介绍一下监控mysql应用。
安装Mysqld_Exporter
其中mysqld_exporter是有官方提供,下载地址:
Mysql_exporter
1wget https://github.com/prometheus/mysqld_exporter/releases/download/v0.12.1/mysqld_exporter-0.12.1.linux-amd64.tar.gz
这些应用程序都是Golang编写的,只有一个二进制文件,通过配置文件或者配置相关的环境变量来运行即可。
1tar xf mysqld_exporter-0.12.1.linux-amd64.tar.gz
2cd mysqld_exporter-0.12.1.linux-amd64
为mysql创建免登录的账号
1CREATE USER 'exporter'@'localhost' IDENTIFIED BY 'Abcd@123' WITH MAX_USER_CONNECTIONS 3;
2GRANT PROCESS, REPLICATION CLIENT, SELECT ON *.* TO 'exporter'@'localhost';
3flush privileges;
创建配置文件/root/.my.cnf
1[client]
2host=localhost
3user=exporter
4password=Abcd@123
5socket=/var/lib/mysql/mysql.sock
运行mysqld_exporter
 1./mysqld_exporter
 2INFO[0000] Starting mysqld_exporter (version=0.12.1, branch=HEAD, revision=48667bf7c3b438b5e93b259f3d17b70a7c9aff96)  source="mysqld_exporter.go:257"
 3INFO[0000] Build context (go=go1.12.7, user=root@0b3e56a7bc0a, date=20190729-12:35:58)  source="mysqld_exporter.go:258"
 4INFO[0000] Enabled scrapers:                             source="mysqld_exporter.go:269"
 5INFO[0000]  --collect.global_status                      source="mysqld_exporter.go:273"
 6INFO[0000]  --collect.global_variables                   source="mysqld_exporter.go:273"
 7INFO[0000]  --collect.slave_status                       source="mysqld_exporter.go:273"
 8INFO[0000]  --collect.info_schema.innodb_cmp             source="mysqld_exporter.go:273"
 9INFO[0000]  --collect.info_schema.innodb_cmpmem          source="mysqld_exporter.go:273"
10INFO[0000]  --collect.info_schema.query_response_time    source="mysqld_exporter.go:273"
11INFO[0000] Listening on :9104                            source="mysqld_exporter.go:283"
运行起来之后默认监听在9104端口,我们可以通过这个http端口,查看指标收集情况。
安装Prometheus和Grafana
Prometheus
 1wget https://github.com/prometheus/prometheus/releases/download/v2.17.0/prometheus-2.17.0.linux-amd64.tar.gz
 2tar xf prometheus-2.17.0.linux-amd64.tar.gz
 3cd prometheus-2.17.0.linux-amd64
 4
 5# 在scrape_configs下添加mysql配置
 6vim prometheus.yml
 7scrape_configs:
 8  - job_name: "mysql"
 9    static_configs:
10    - targets: ['localhost:9104']
11
12./prometheus
13level=info ts=2020-03-26T15:10:30.855Z caller=main.go:298 msg="no time or size retention was set so using the default time retention" duration=15d
14level=info ts=2020-03-26T15:10:30.855Z caller=main.go:333 msg="Starting Prometheus" version="(version=2.17.0, branch=HEAD, revision=39e01b369dbd78278ca63e54f4976dff3b41df98)"
15level=info ts=2020-03-26T15:10:30.855Z caller=main.go:334 build_context="(go=go1.13.9, user=root@604d4517e800, date=20200324-17:04:11)"
16level=info ts=2020-03-26T15:10:30.855Z caller=main.go:335 host_details="(Linux 4.18.0-147.5.1.el8_1.x86_64 #1 SMP Wed Feb 5 02:00:39 UTC 2020 x86_64 node01 (none))"
17level=info ts=2020-03-26T15:10:30.855Z caller=main.go:336 fd_limits="(soft=1024000, hard=1024000)"
18level=info ts=2020-03-26T15:10:30.855Z caller=main.go:337 vm_limits="(soft=unlimited, hard=unlimited)"
19level=info ts=2020-03-26T15:10:30.859Z caller=main.go:667 msg="Starting TSDB ..."
20level=info ts=2020-03-26T15:10:30.861Z caller=web.go:514 component=web msg="Start listening for connections" address=0.0.0.0:9090
21level=info ts=2020-03-26T15:10:30.874Z caller=head.go:575 component=tsdb msg="replaying WAL, this may take awhile"
22level=info ts=2020-03-26T15:10:30.906Z caller=head.go:624 component=tsdb msg="WAL segment loaded" segment=0 maxSegment=3
23level=info ts=2020-03-26T15:10:30.963Z caller=head.go:624 component=tsdb msg="WAL segment loaded" segment=1 maxSegment=3
24level=info ts=2020-03-26T15:10:31.041Z caller=head.go:624 component=tsdb msg="WAL segment loaded" segment=2 maxSegment=3
25level=info ts=2020-03-26T15:10:31.041Z caller=head.go:624 component=tsdb msg="WAL segment loaded" segment=3 maxSegment=3
26level=info ts=2020-03-26T15:10:31.041Z caller=head.go:627 component=tsdb msg="WAL replay completed" duration=167.254135ms
27level=info ts=2020-03-26T15:10:31.047Z caller=main.go:683 fs_type=XFS_SUPER_MAGIC
28level=info ts=2020-03-26T15:10:31.047Z caller=main.go:684 msg="TSDB started"
29level=info ts=2020-03-26T15:10:31.048Z caller=main.go:788 msg="Loading configuration file" filename=prometheus.yml
30level=info ts=2020-03-26T15:10:31.049Z caller=main.go:816 msg="Completed loading of configuration file" filename=prometheus.yml
31level=info ts=2020-03-26T15:10:31.050Z caller=main.go:635 msg="Server is ready to receive web requests."
Grafana
通过官网找到下载地址
1wget https://dl.grafana.com/oss/release/grafana-6.7.1.linux-amd64.tar.gz
2tar xf grafana-6.7.1.linux-amd64.tar.gz
3cd grafana-6.7.1/bin
4./grafana-server
5...
6INFO[03-26|23:13:27] Initializing Stream Manager
7INFO[03-26|23:13:27] HTTP Server Listen                       logger=http.server address=[::]:3000 protocol=http subUrl= socket=
8...
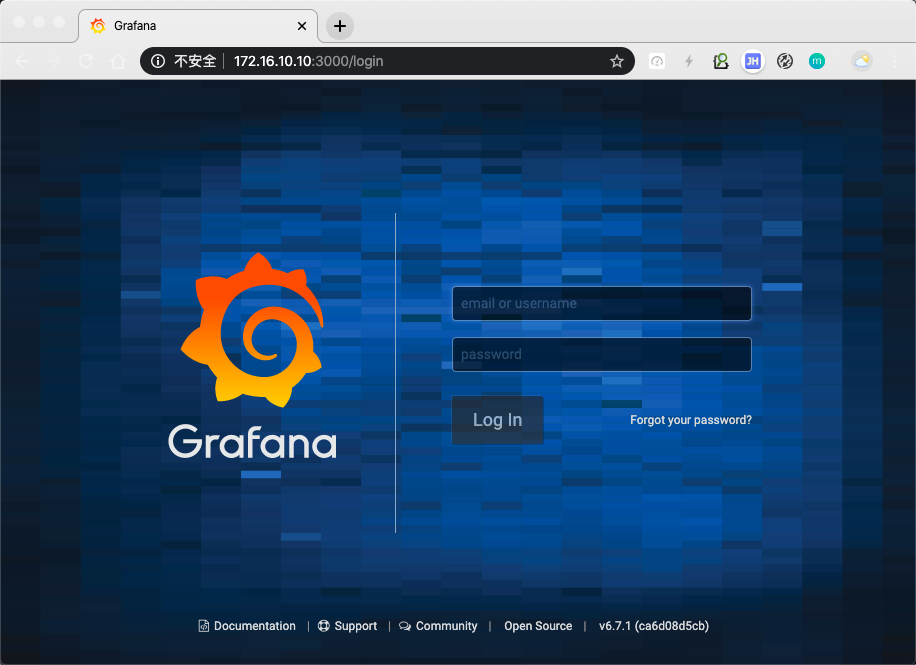
配置文件可以使用默认的,运行起来之后监听在3000端口,
配置
我们通过web浏览器打开。默认用户名密码均为admin。
配置数据源
选择prometheus,输入prometheus的地址信息,我这里是http://localhost:9090, 点击Save&Test
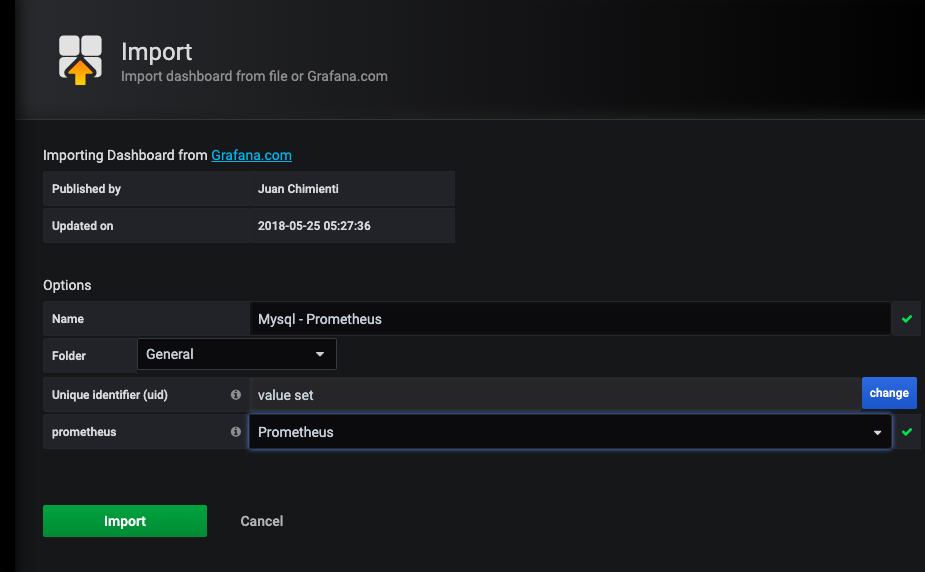
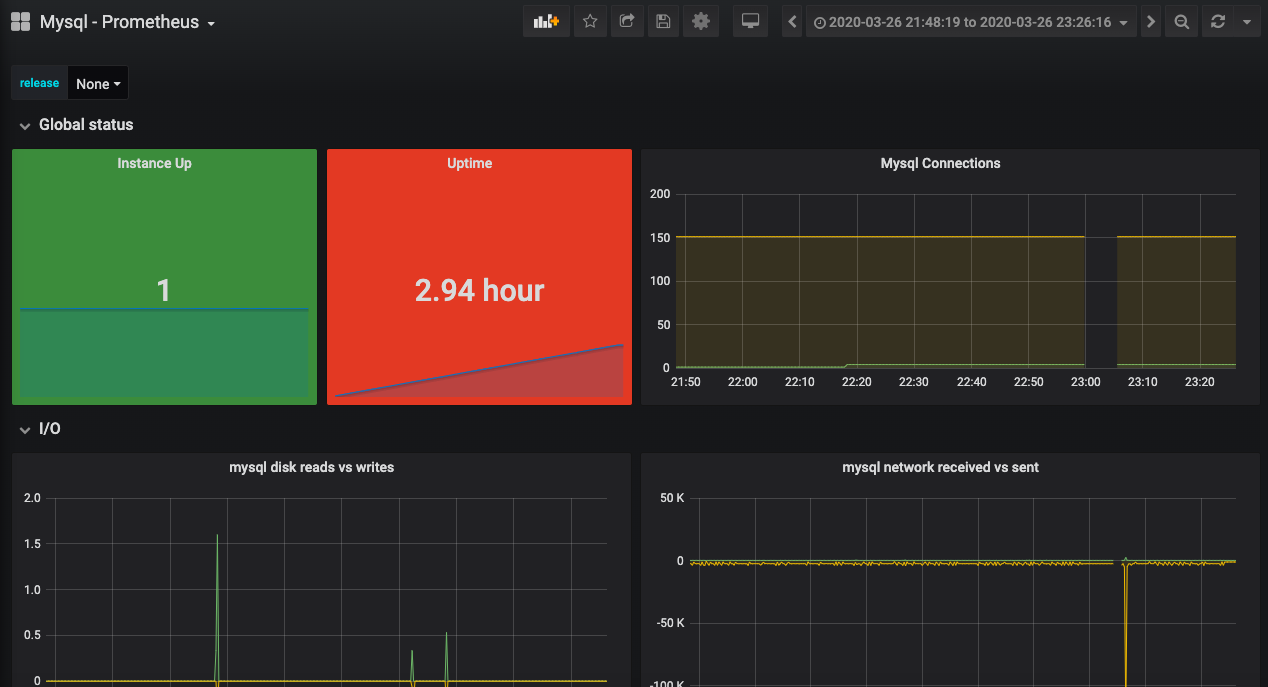
导入模版
可以在grafana的dashboard上查找,数据库为prometheus,搜索关键字mysql,在import界面输入对应的ID号,点击Load按钮进行载入。我这里以6239为例
- 原文作者:黄忠德
- 原文链接:https://huangzhongde.cn/post/Linux/2020-03-27_%E4%BD%BF%E7%94%A8prometheus%E7%9B%91%E6%8E%A7mysql/
- 版权声明:本作品采用知识共享署名-非商业性使用-禁止演绎 4.0 国际许可协议进行许可,非商业转载请注明出处(作者,原文链接),商业转载请联系作者获得授权。