使用Prometheus监控常用中间件
常用中间件
中间件指系统软件和应用软件之间的连接软件,无论是在分布式系统还是在单体系统中,中间件都发挥着重要的作用。
常用的中间件主要有以下几类:
- 数据库中间件: 如PostgreSQL
- 消息中间件:如Kafka
- 缓存中间件:如Redis
- Web服务中间件: 如nginx
安装Prometheus
这里假设你已经安装好了Prometheus和Grafana,如果没有可以查看前面的博客。使用Prometheus监控MySQL
监控Redis
1wget https://github.com/oliver006/redis_exporter/releases/download/v1.5.2/redis_exporter-v1.5.2.linux-amd64.tar.gz
2tar xf redis_exporter-v1.5.2.linux-amd64.tar.gz
3cd redis_exporter-v1.5.2.linux-amd64
4
5./redis_exporter
6INFO[0000] Redis Metrics Exporter v1.5.2    build date: 2020-03-16-20:52:04    sha1: 18080da36b0a97595d308cfb4bdf92eb1e396c44    Go: go1.14    GOOS: linux    GOARCH: amd64
7INFO[0000] Providing metrics at :9121/metrics
默认运行在9121端口上,可以通过浏览器查看redis的指标。http://172.16.10.10:9121/metrics
重要参数说明
1-redis.addr     // redis服务地址,默认为redis://localhost:2379
2-redis.password // redis服务密码,如果有设置密码,需要指定
监控Kafka
1wget https://github.com/danielqsj/kafka_exporter/releases/download/v1.2.0/kafka_exporter-1.2.0.linux-amd64.tar.gz
2tar xf kafka_exporter-1.2.0.linux-amd64.tar.gz
3cd kafka_exporter-1.2.0.linux-amd64
4
5./kafka_exporter --kafka.server=127.0.0.1:9092
6INFO[0000] Starting kafka_exporter (version=1.2.0, branch=HEAD, revision=830660212e6c109e69dcb1cb58f5159fe3b38903)  source="kafka_exporter.go:474"
7INFO[0000] Build context (go=go1.10.3, user=root@981cde178ac4, date=20180707-14:34:48)  source="kafka_exporter.go:475"
8INFO[0000] Done Init Clients                             source="kafka_exporter.go:213"
9INFO[0000] Listening on :9308                            source="kafka_exporter.go:499"
程序默认监听在9308端口上,可通过浏览器访问该端口,查看kafka相关指标。http://172.16.10.10:9308/metrics
重要参数说明
1--kafka.server // kafka服务器地址以及端口
监控nginx
需要ngx_http_stub_status_module模块的支持,通过nginx -V查看是否已经安装了该模块
配置性能统计模块
1location /stub_status{
2    stub_status  on;
3    access_log   off;
4}
1wget https://github.com/nginxinc/nginx-prometheus-exporter/releases/download/v0.6.0/nginx-prometheus-exporter-0.6.0-linux-amd64.tar.gz
2tar xf nginx-prometheus-exporter-0.6.0-linux-amd64.tar.gz
3
4./nginx-prometheus-exporter
重要参数说明
1-nginx.scrape-uri // 统计页面地址,默认为 "http://127.0.0.1:8080/stub_status",如果不是这个,需要指定
程序默认监听在9113端口上
监控PostgreSQL
 1wget https://github.com/wrouesnel/postgres_exporter/releases/download/v0.8.0/postgres_exporter_v0.8.0_linux-amd64.tar.gz
 2tar xf postgres_exporter_v0.8.0_linux-amd64.tar.gz
 3cd postgres_exporter_v0.8.0_linux-amd64
 4
 5# DATA_SOURCE_NAME替换成你自己的
 6export DATA_SOURCE_NAME="postgresql://login:password@hostname:port/dbname"
 7./postgres_exporter
 8INFO[0000] Established new database connection to "127.0.0.1:5432".  source="postgres_exporter.go:878"
 9INFO[0000] Semantic Version Changed on "127.0.0.1:5432": 0.0.0 -> 10.6.0  source="postgres_exporter.go:1405"
10INFO[0000] Starting Server: :9187                        source="postgres_exporter.go:1672"
程序默认监听在9187端口上
重要参数说明
1--auto-discover-databases // 自动发现数据库
Prometheus配置
修改prometheus.yml配置文件,添加上面几个服务的指标采集的信息
 1  - job_name: "redis"
 2    static_configs:
 3    - targets: ['localhost:9121']
 4  - job_name: "kafka"
 5    static_configs:
 6    - targets: ['localhost:9308']
 7  - job_name: "nginx"
 8    static_configs:
 9    - targets: ['localhost:9113']
10  - job_name: "postgres"
11    static_configs:
12    - targets: ['localhost:9187']
修改完配置文件重启prometheus
Grafana展示
安装过程略, 使用Prometheus监控MySQL
通过grafana下载dashboard进行展示
下面推荐几款Dashboard ID
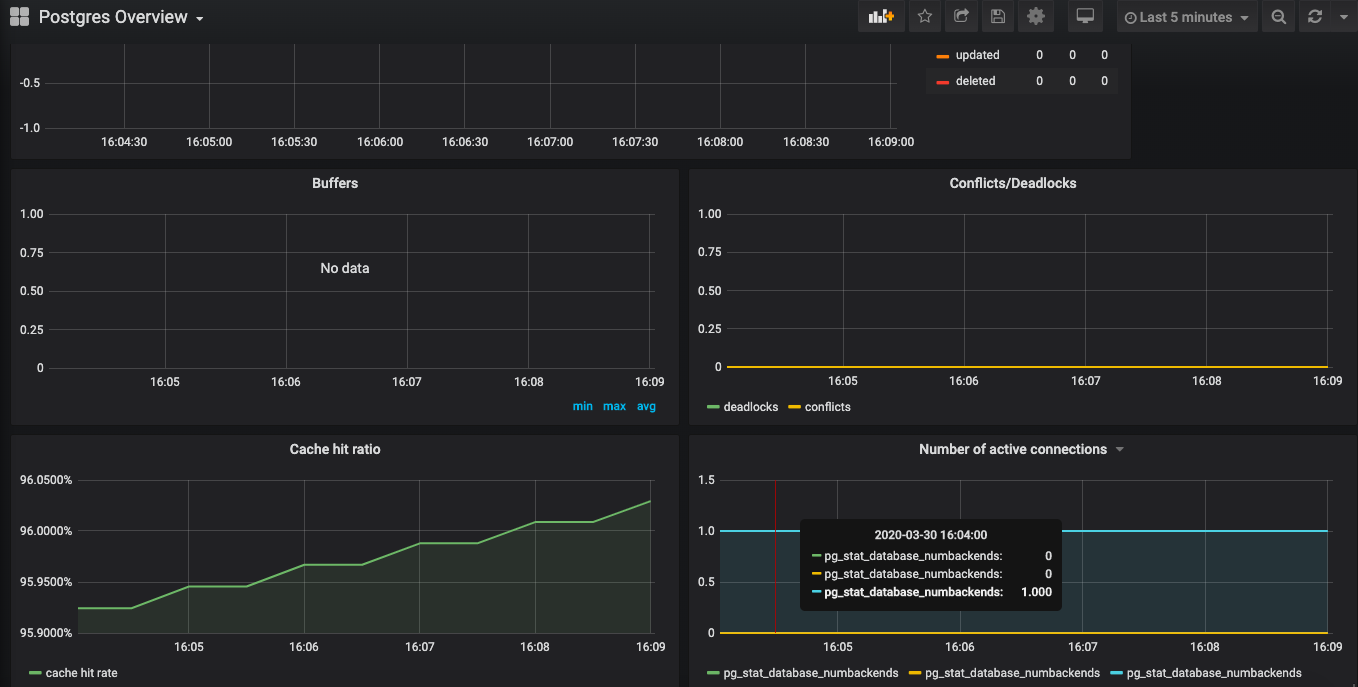
PostgreSQL: 455 9628
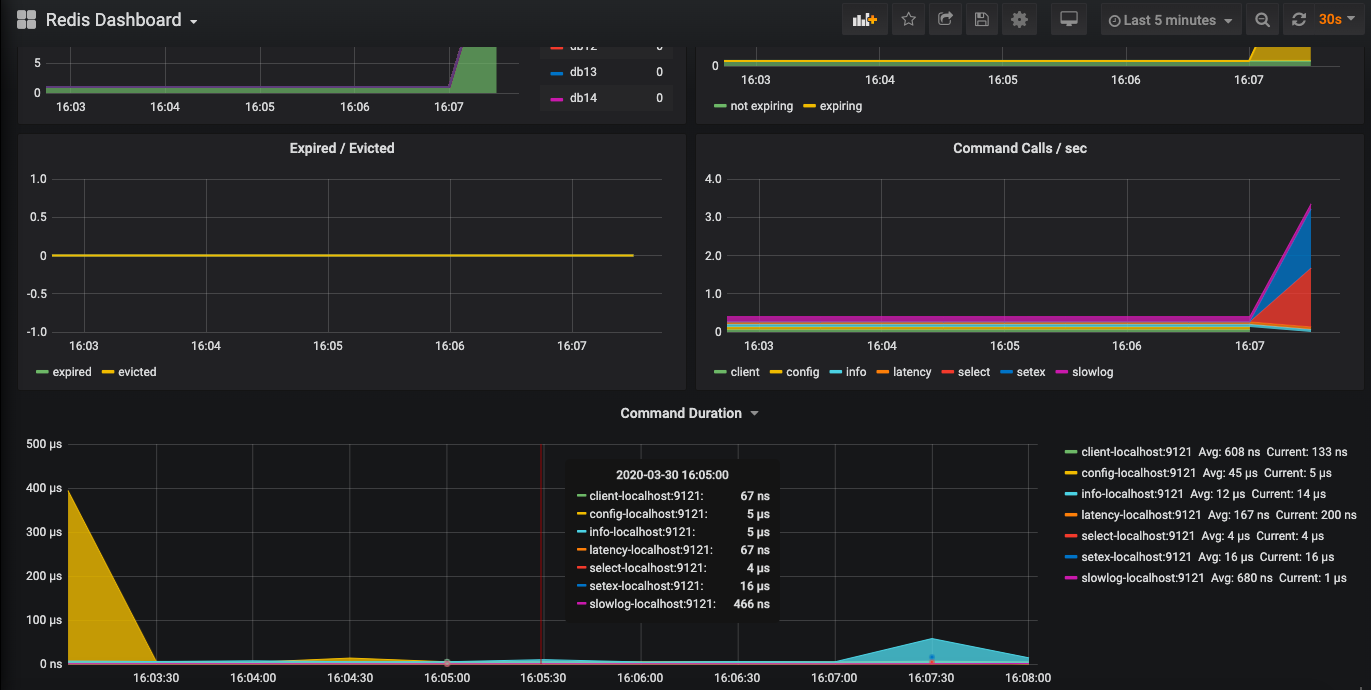
Redis: 2751
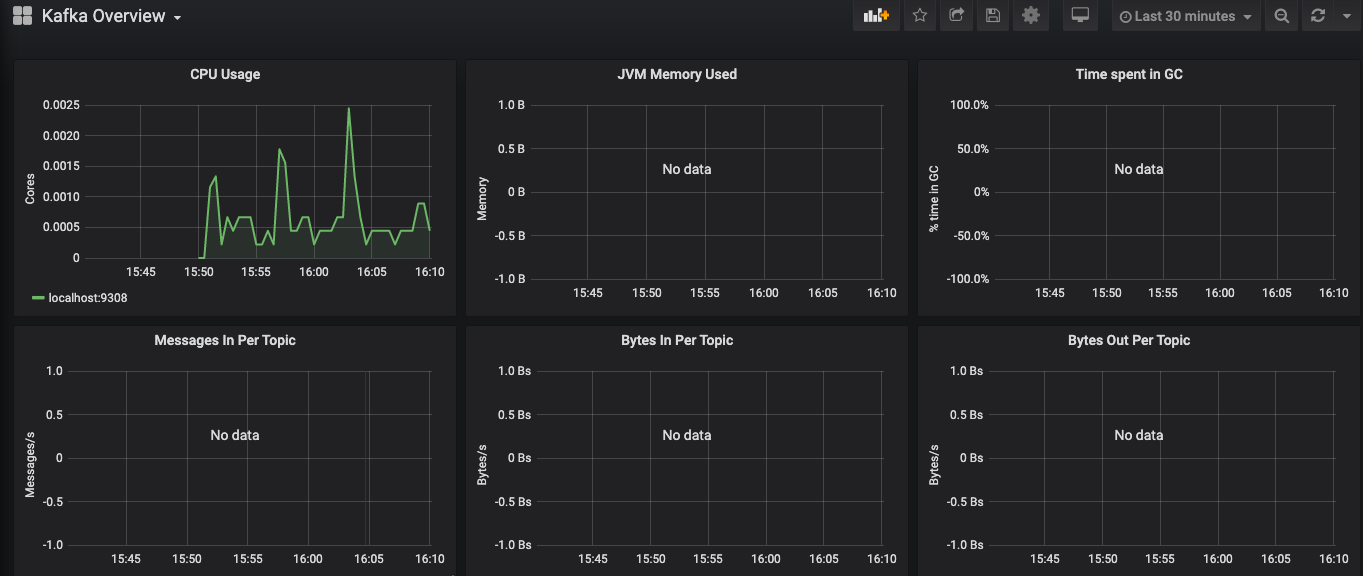
Kafka: 721
Nginx: 1623
分享几张截图
- 原文作者:黄忠德
- 原文链接:https://huangzhongde.cn/post/Linux/prometheus_monitoring_middlewares/
- 版权声明:本作品采用知识共享署名-非商业性使用-禁止演绎 4.0 国际许可协议进行许可,非商业转载请注明出处(作者,原文链接),商业转载请联系作者获得授权。